Physical Address
304 North Cardinal St.
Dorchester Center, MA 02124
Physical Address
304 North Cardinal St.
Dorchester Center, MA 02124
Technology advances in the blink of an eye, and no single programming language or software will be suitable for every job. Having said this, WordPress does make building websites and web apps easy and almost free!
While some people believe that WordPress isn’t powerful enough for building websites or web apps, it is possible to build scalable websites and applications. Thousands of plugins and themes online are available to enable you to start creating your website, depending on your project requirement.
Developing a WordPress website may seem easy at first but maintenance can be complex. If you are not sure what needs to be done to maintain a WordPress website or maintain efficiency to keep it updated, safe and secure, then it can be intimidating.
Even with necessary precautions to maintain and make your WordPress website safe and secure, your website can still go down for reasons beyond your control. Downtime of a website could cost you potential customers, visitors, and money. When this happens, you need to be always informed and prepared to quickly put things back in order and notify your website’s potential customers, visitors, and even your team for outages and incidents.
Uptime monitoring is the process of checking your website’s availability, including server response time in a publicly or privately accessible manner. Uptime monitoring provides an overview of your website and domain availability history and performance metrics which sometimes include country and region server monitoring. It may also have an alert feature that will notify you or your team about your website’s problem as soon as it occurs via several technology mediums or tools.
Some benefits of uptime monitoring include:
The goal of every website server is always to get 100% uptime which is unattainable most of the time, but 99.999% (also known as “five-nines availability”) of uptime is considered the industry standard if you want your website to rank higher on search engines.
There are various tools, platforms, and services available online that you can use to monitor the uptime of your website. In this tutorial, we will use Pulsetic to monitor WordPress website uptime.
Pulsetic is an uptime monitoring service platform that allows users to manage incident reports by giving downtime alerts via phone call, SMS, email, or Slack when a user’s website is down. It comes with four pricing plans which can be subscribed to monthly or annually.
G2 reviewers have awarded Pulsetic an impressive 4.8-star rating, highlighting its standout performance in comparison to its competitors.
Pulsetic monitors from more data centers around the globe to guarantee redundancy and localize outages as it shows you in which part of the world your website is down or slow. The best thing about Pulsetic is that it sends users an alert notification via email, SMS, and Slack, where users can access the uptime monitoring metrics to learn more about your website’s uptime performance.
Assuming that we already have a fresh installation of WordPress at our disposal, let’s first choose a WordPress theme that we will use in our demo. Please refer to my previous tutorial if you need a guide on installing a WordPress theme using Softaculous Cpanel Software.
When choosing a WordPress theme, selecting a Gutenberg-ready theme is crucial. In this tutorial, we will use Blocksy, the most innovative, lightning-fast, and supercharged Gutenberg-ready WordPress theme.
[figure id=”attachment_644326″ align=”alignnone”]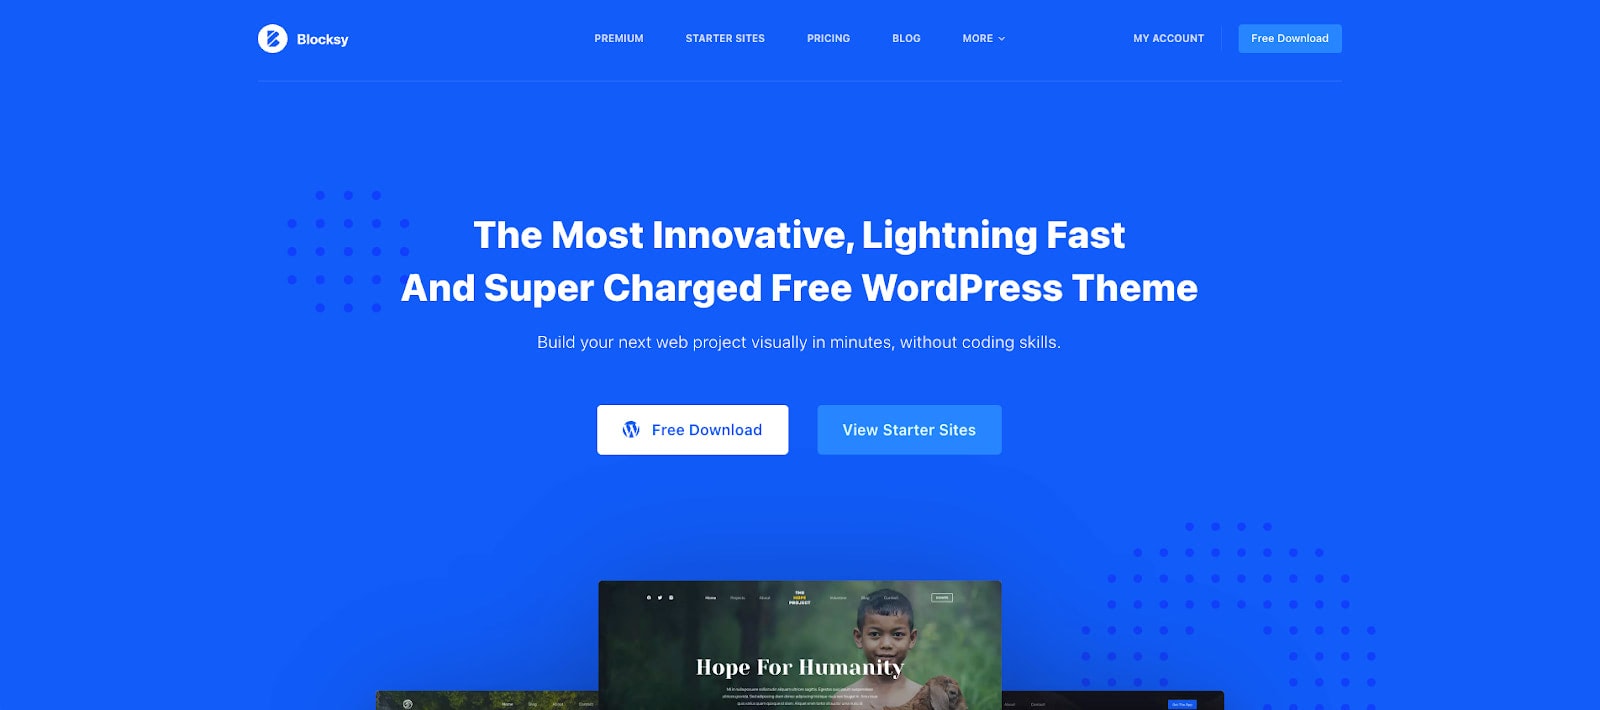 [/figure]
Blocksy is faster and lightweight than most similar WordPress themes. It is packed with dozens of cool key features inside, including:
To add the Blocksy WordPress theme, head to your WordPress login URL and log in using your username and password.
Once logged into the WordPress Dashboard, click on “Appearance” followed by “Themes” located on the left menu panel. Afterward, click on the “Add New” button, as seen in the image below.
[figure class=”wide” id=”attachment_644327″ align=”alignnone”]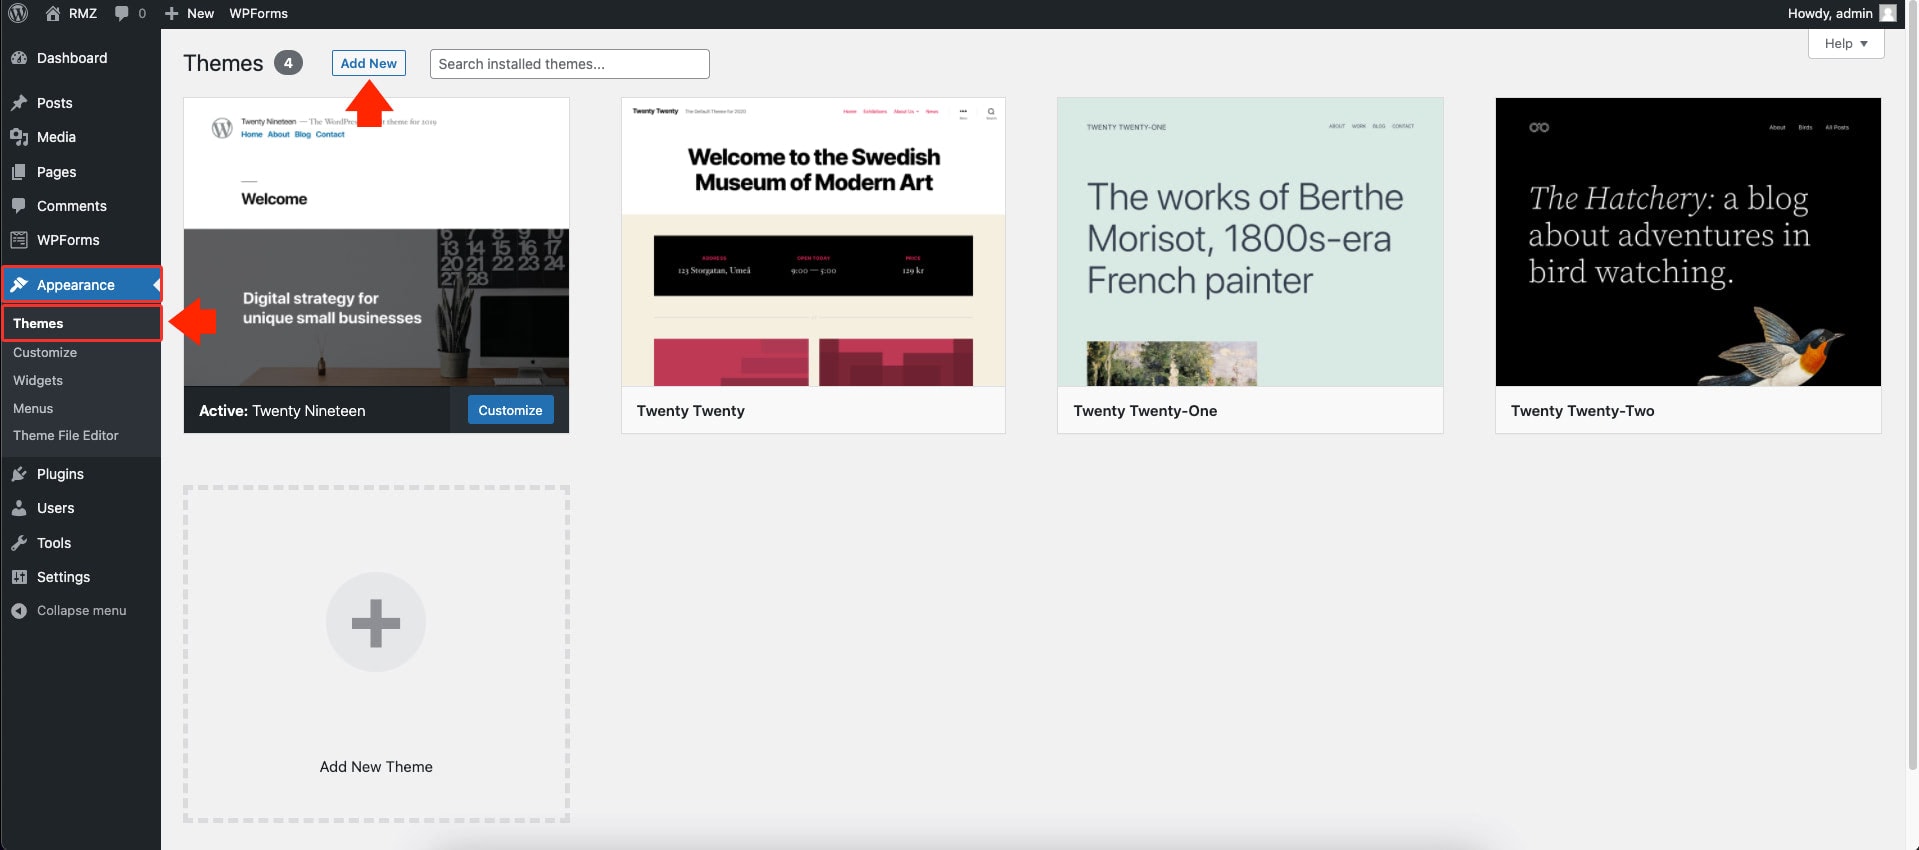 [/figure]
Next, search for “Blocksy” and it will return the Blocksy WordPress theme on the search result as seen in the image below.
[figure class=”wide” id=”attachment_644330″ align=”alignnone”]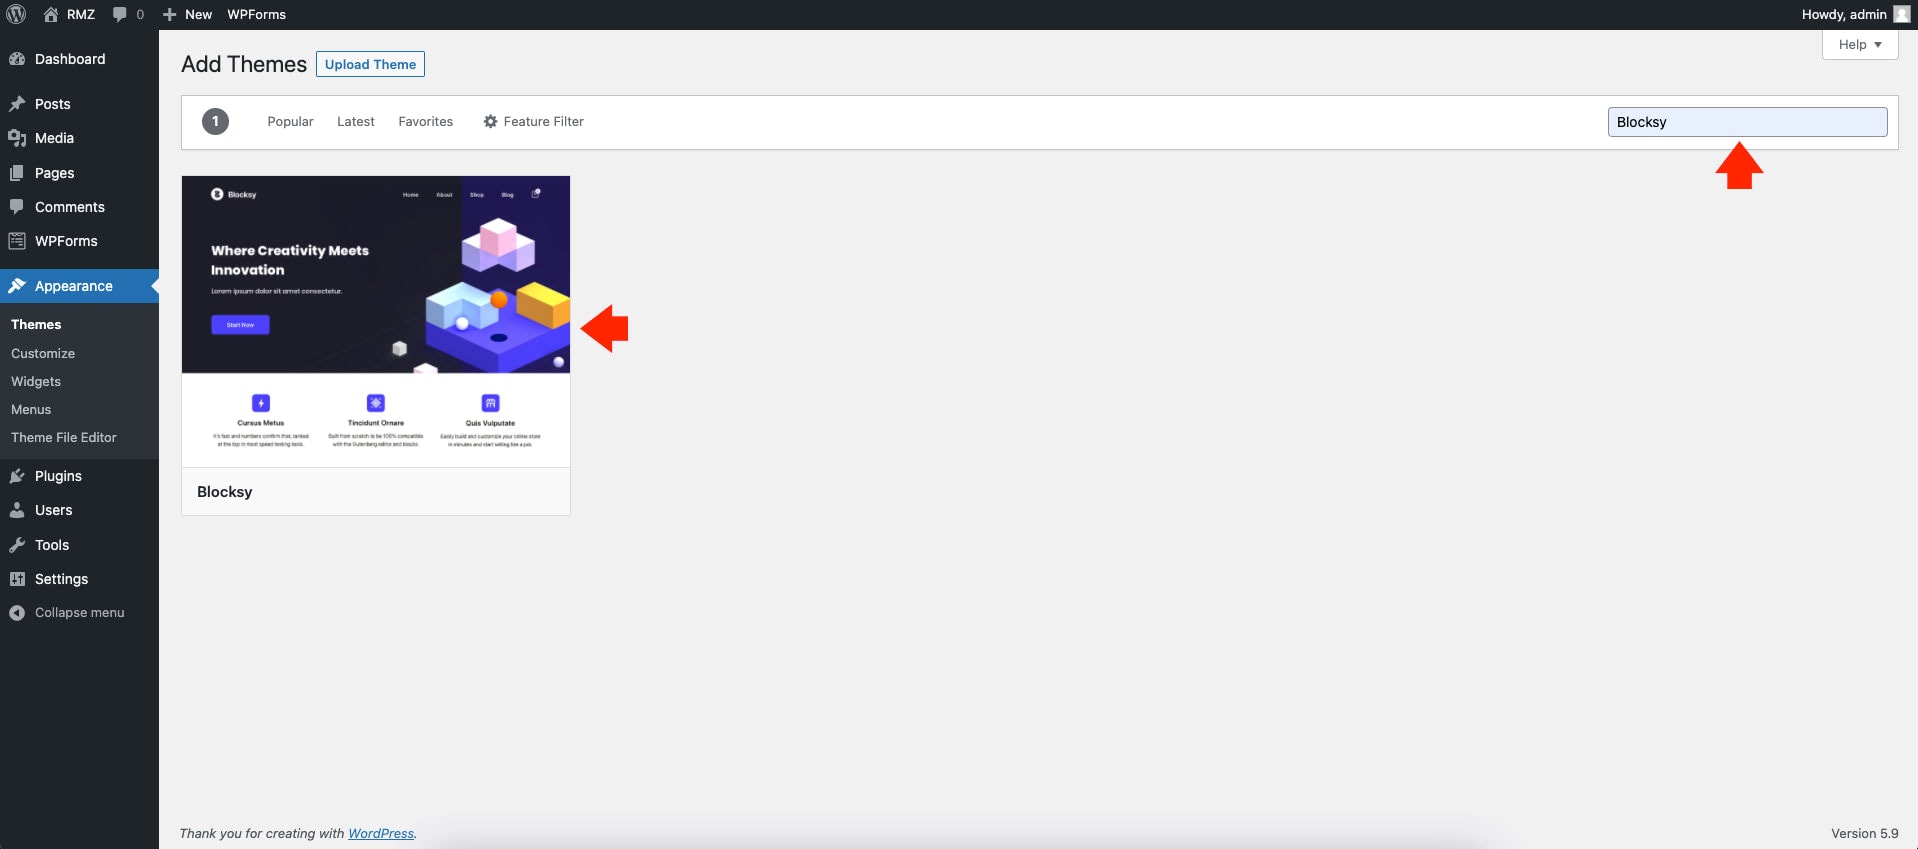 [/figure]
From here, hover your mouse on the Blocksy WordPress Theme search result and click on the “Install” button. Next, click on the “Activate” button to activate the theme.
[figure class=”wide” id=”attachment_644332″ align=”alignnone”]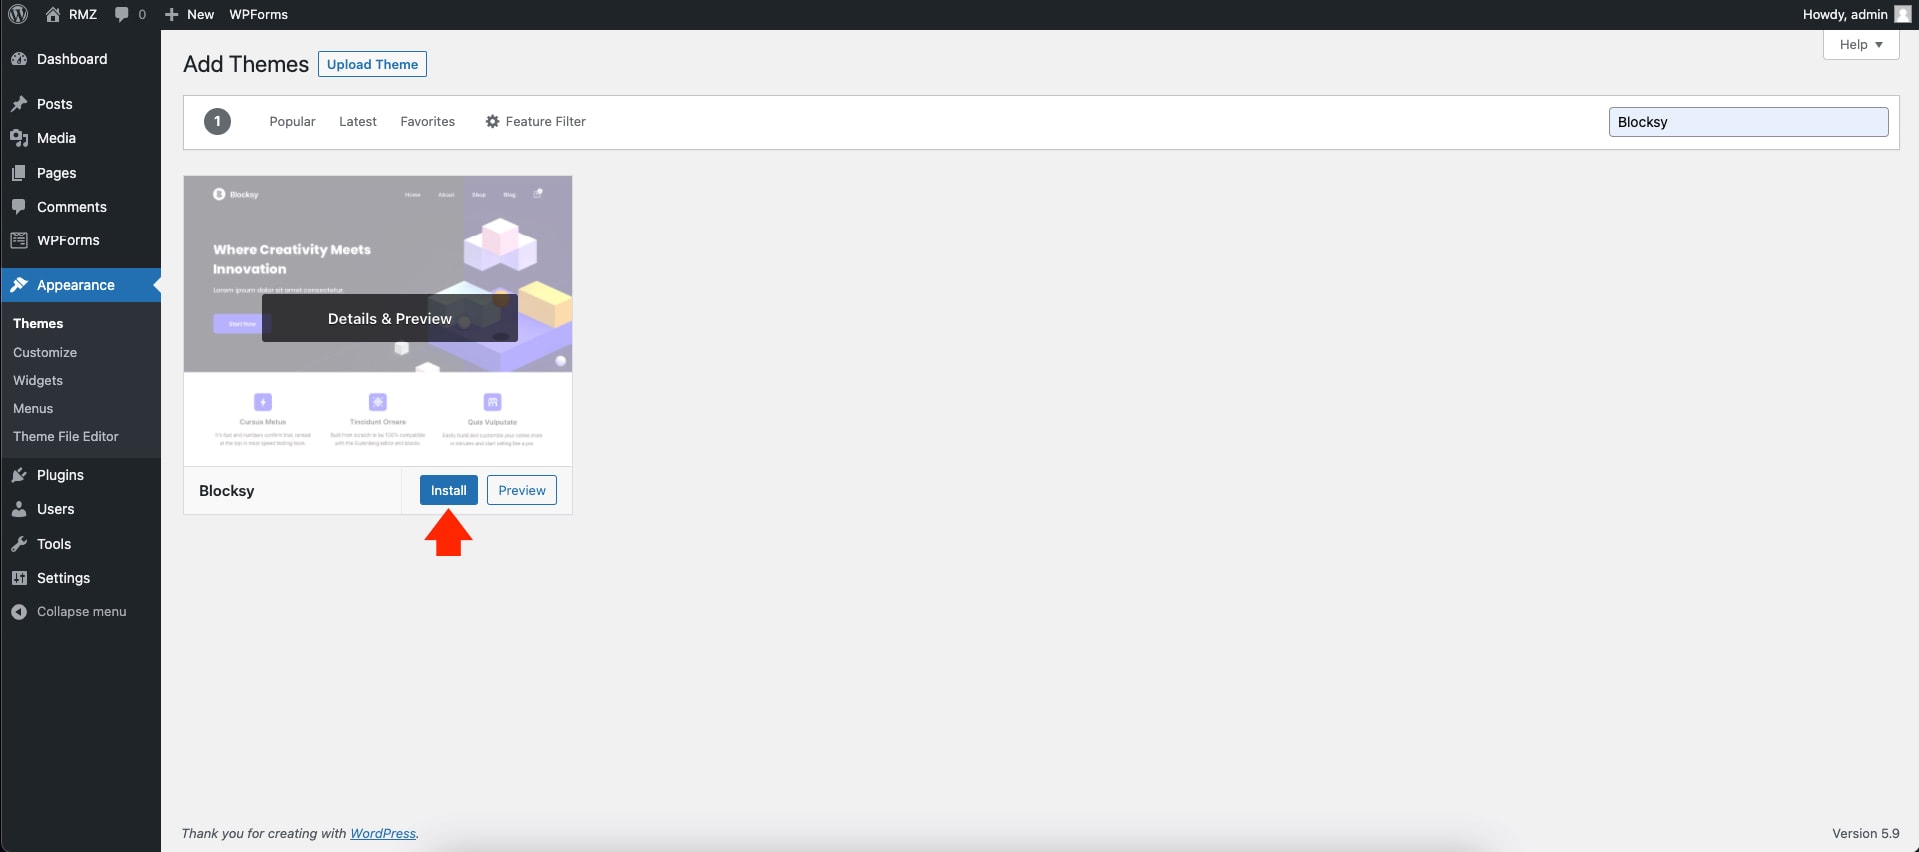 [/figure]
At this point, the Blocksy WordPress Theme is already installed. The next step is to activate Blocksy Companion to select our preferred design for our WordPress website. Click on the “Activate Blocksy Companion” button and it will install the companion settings of the theme, as seen in the image below.
[figure class=”wide” id=”attachment_644333″ align=”alignnone”]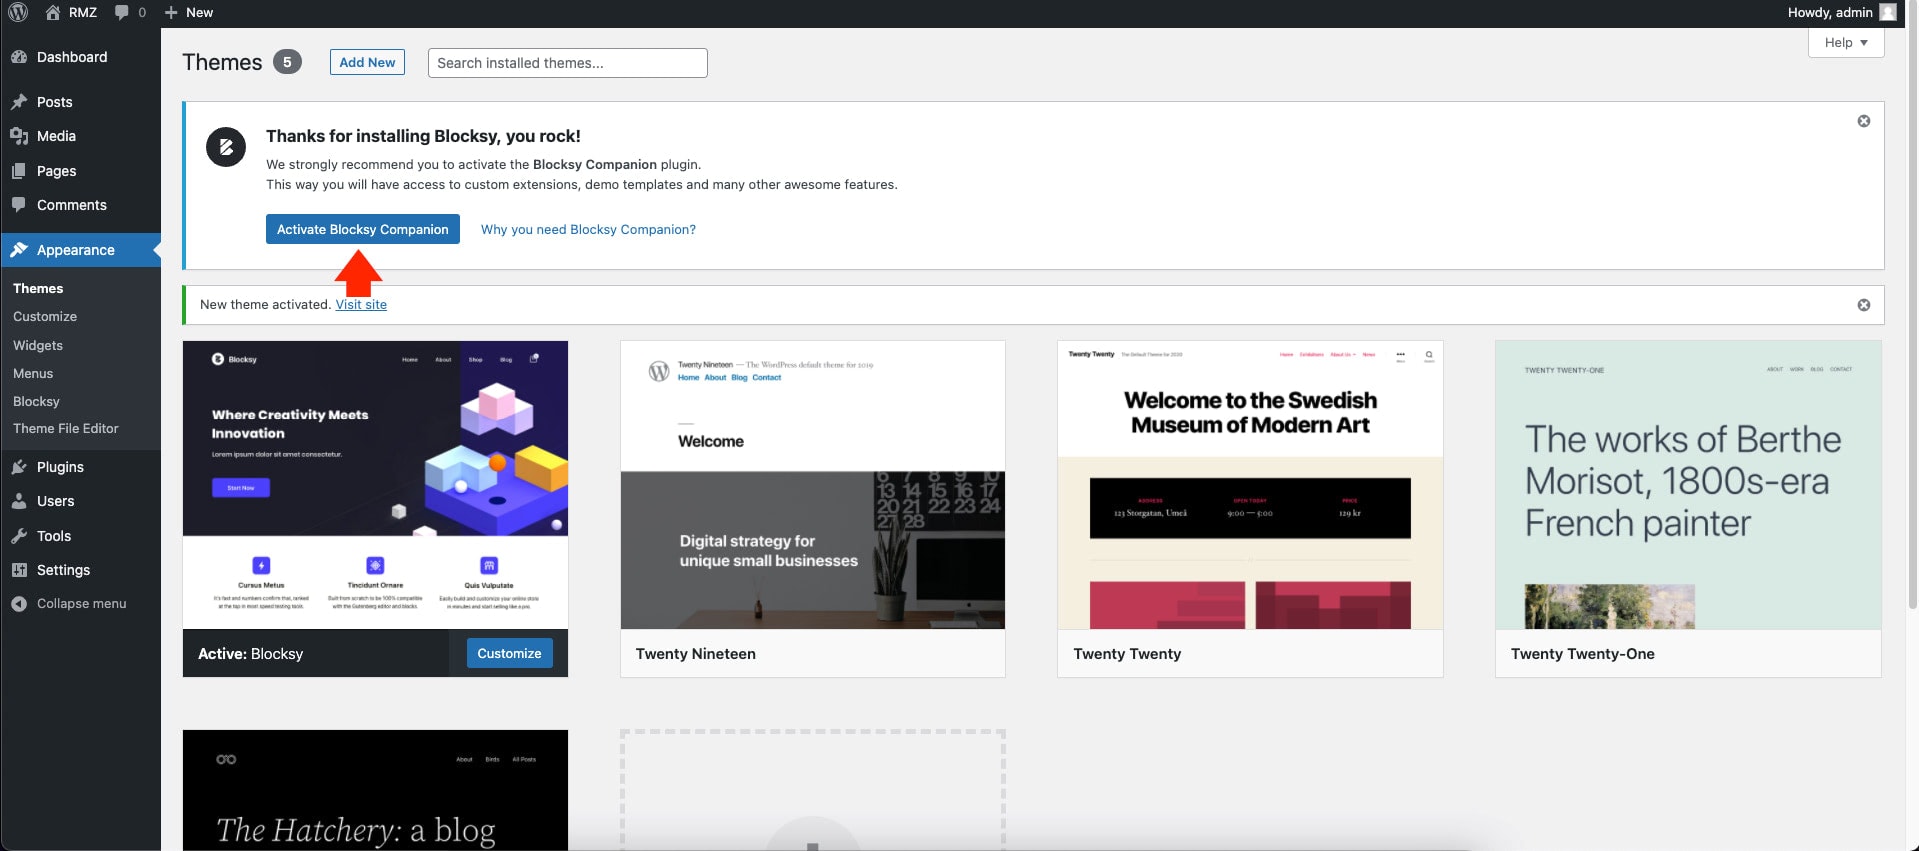 [/figure]
After installing the companion settings, go to the Blocksy WordPress Theme Dashboard and click on the “Starter Sites” Tab. We can choose the look and feel we prefer for our WordPress website on this tab.
[figure class=”wide” id=”attachment_644334″ align=”alignnone”]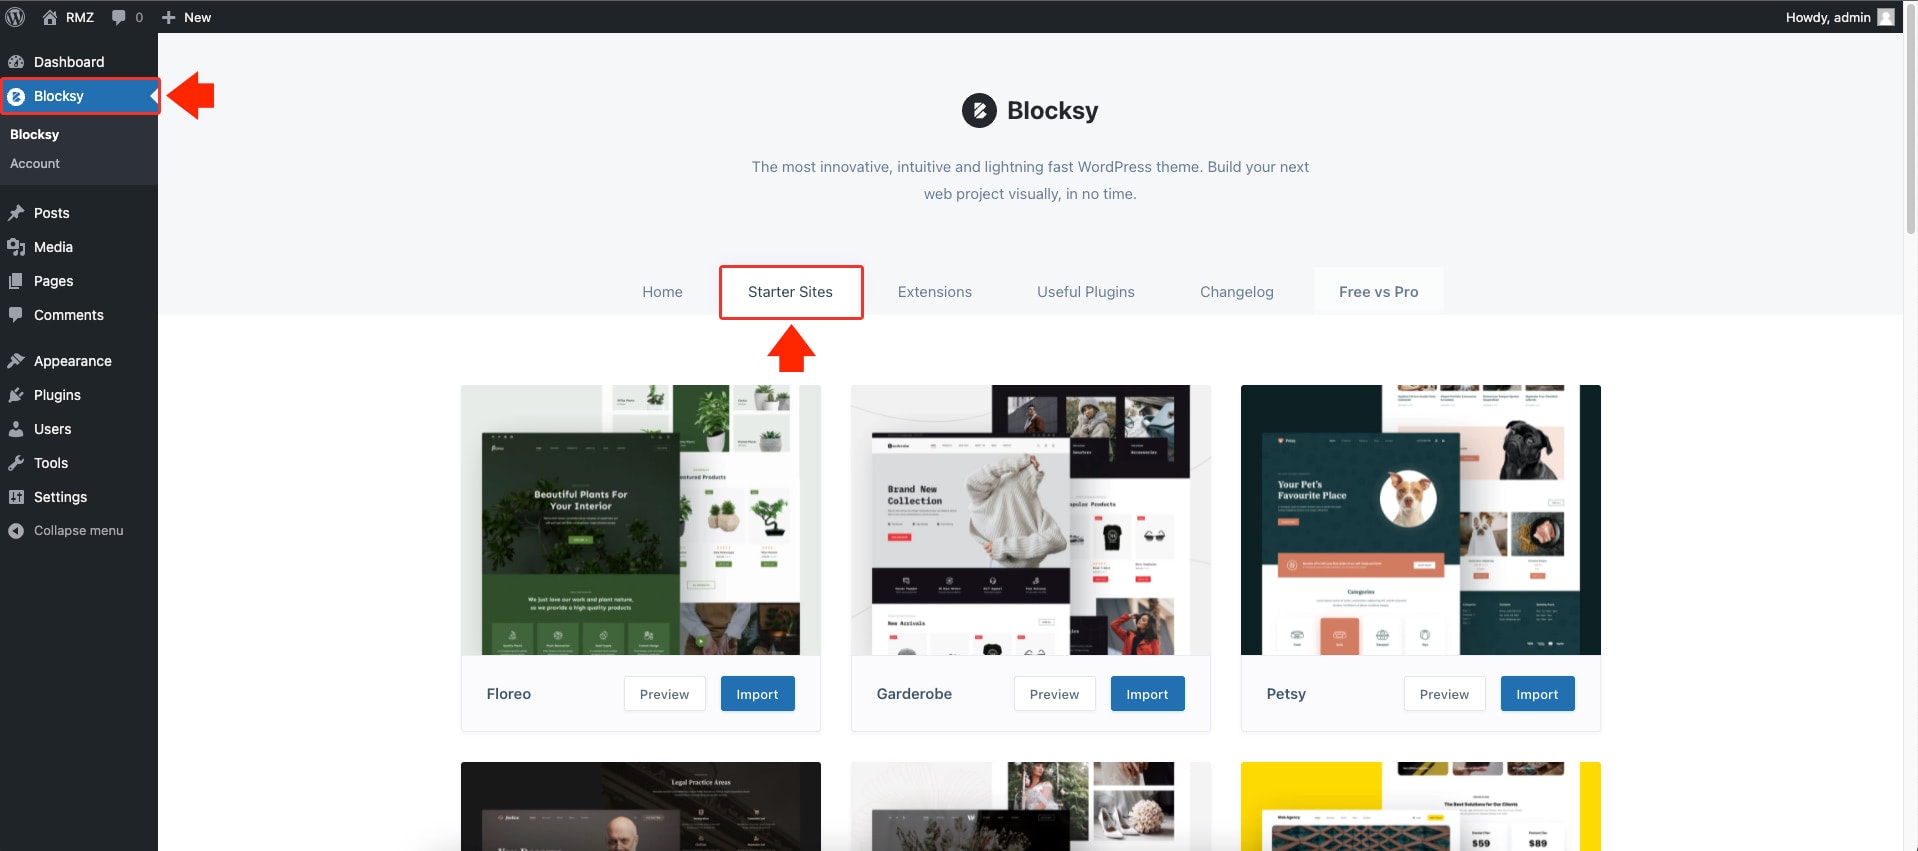 [/figure]
In this tutorial, let’s use the “Persona” theme, which can be found in the middle part of the first row of the theme’s list. To install this theme, click on the “Import” button, and it will start prompting a few questions about the import, such as if you want to install it as a child theme, including the plugins and widgets that you want to install that comes with the theme design.
A new modal window will then pop out on the screen; click on the “Next” button until the “Install” button appears, and we are good to go.
[figure class=”wide” id=”attachment_644335″ align=”alignnone”]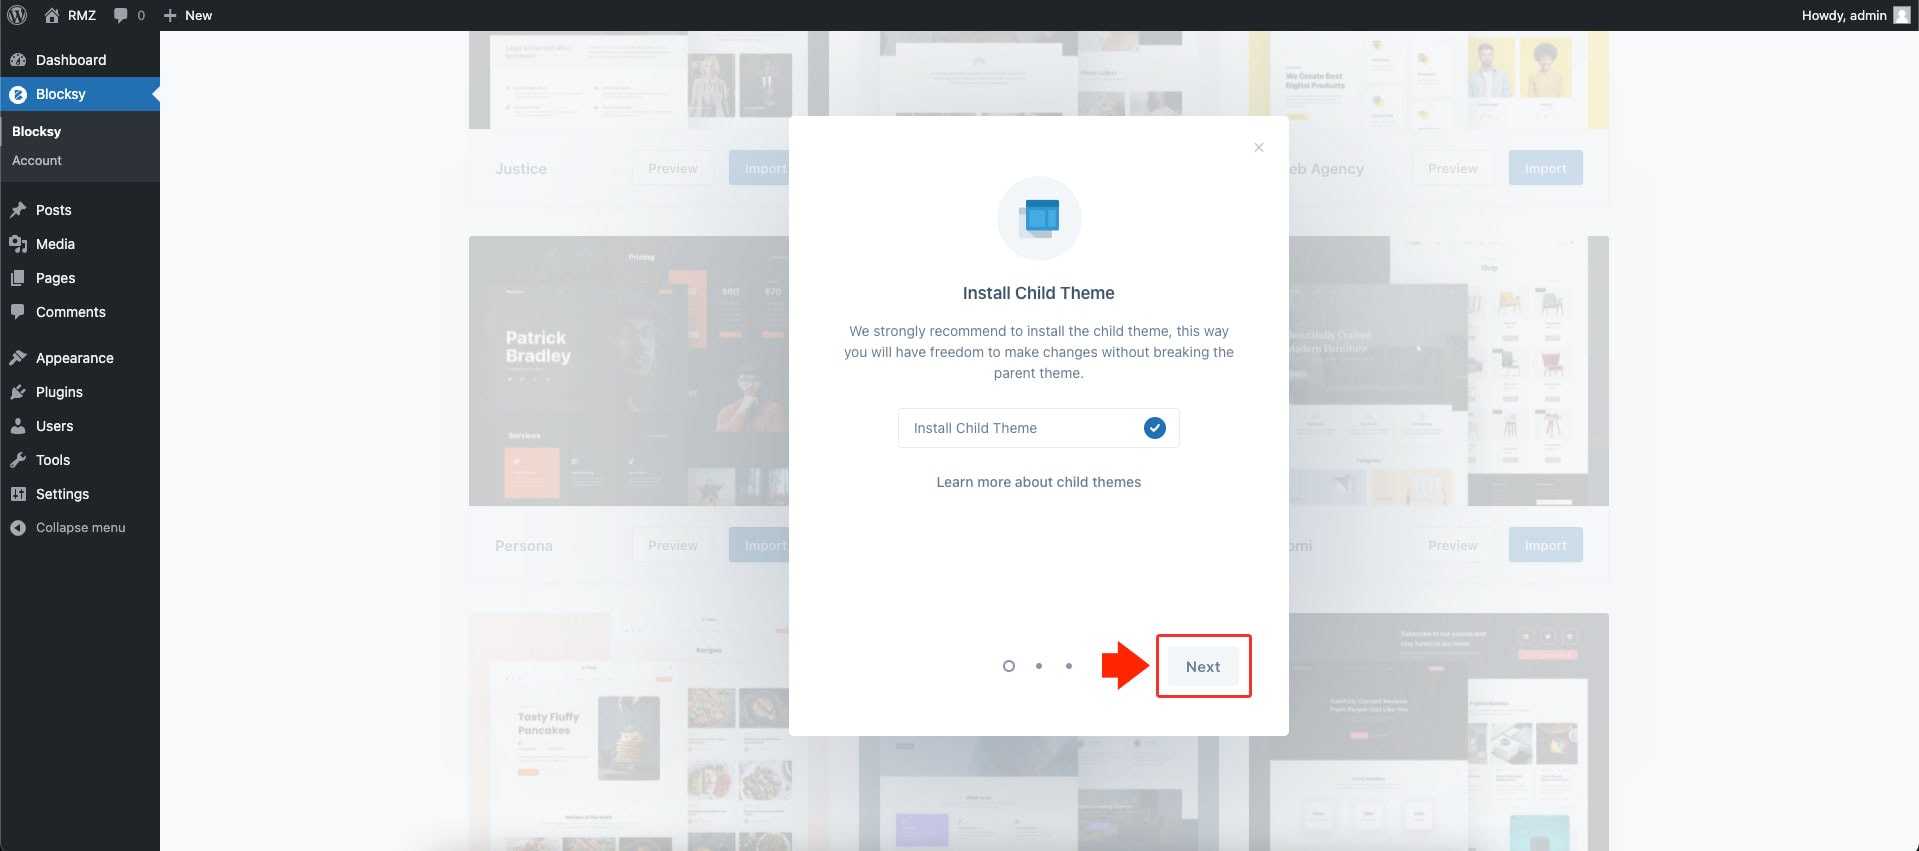 [/figure]
[figure class=”wide” id=”attachment_644336″ align=”alignnone”]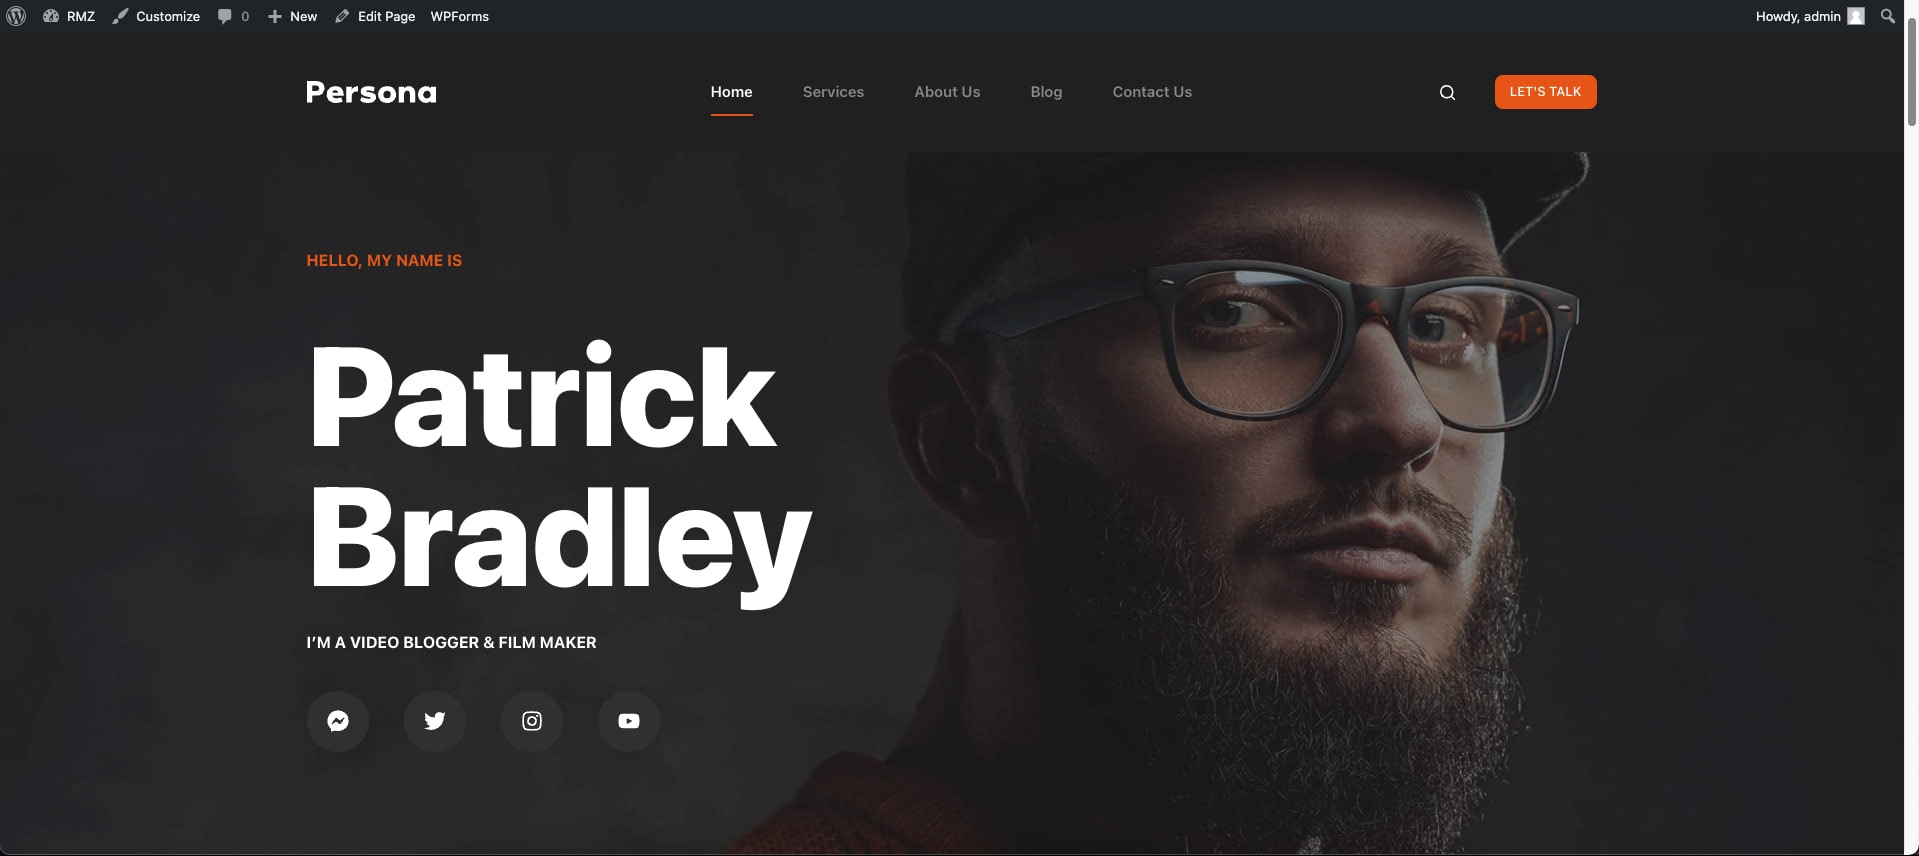 [/figure]
Once the installation is complete, visit our homepage URL to see the look and feel of our chosen theme. Please feel free to customize the content as you may like, but this should work for the sake of our demo.
We need to create a free account before adding our website to the Pulsetic dashboard. To do this, go to https://pulsetic.com/ and click on the “Signup” button on the upper right corner of the homepage and we will be redirected to the signup page.
[figure class=”wide” id=”attachment_644337″ align=”alignnone”]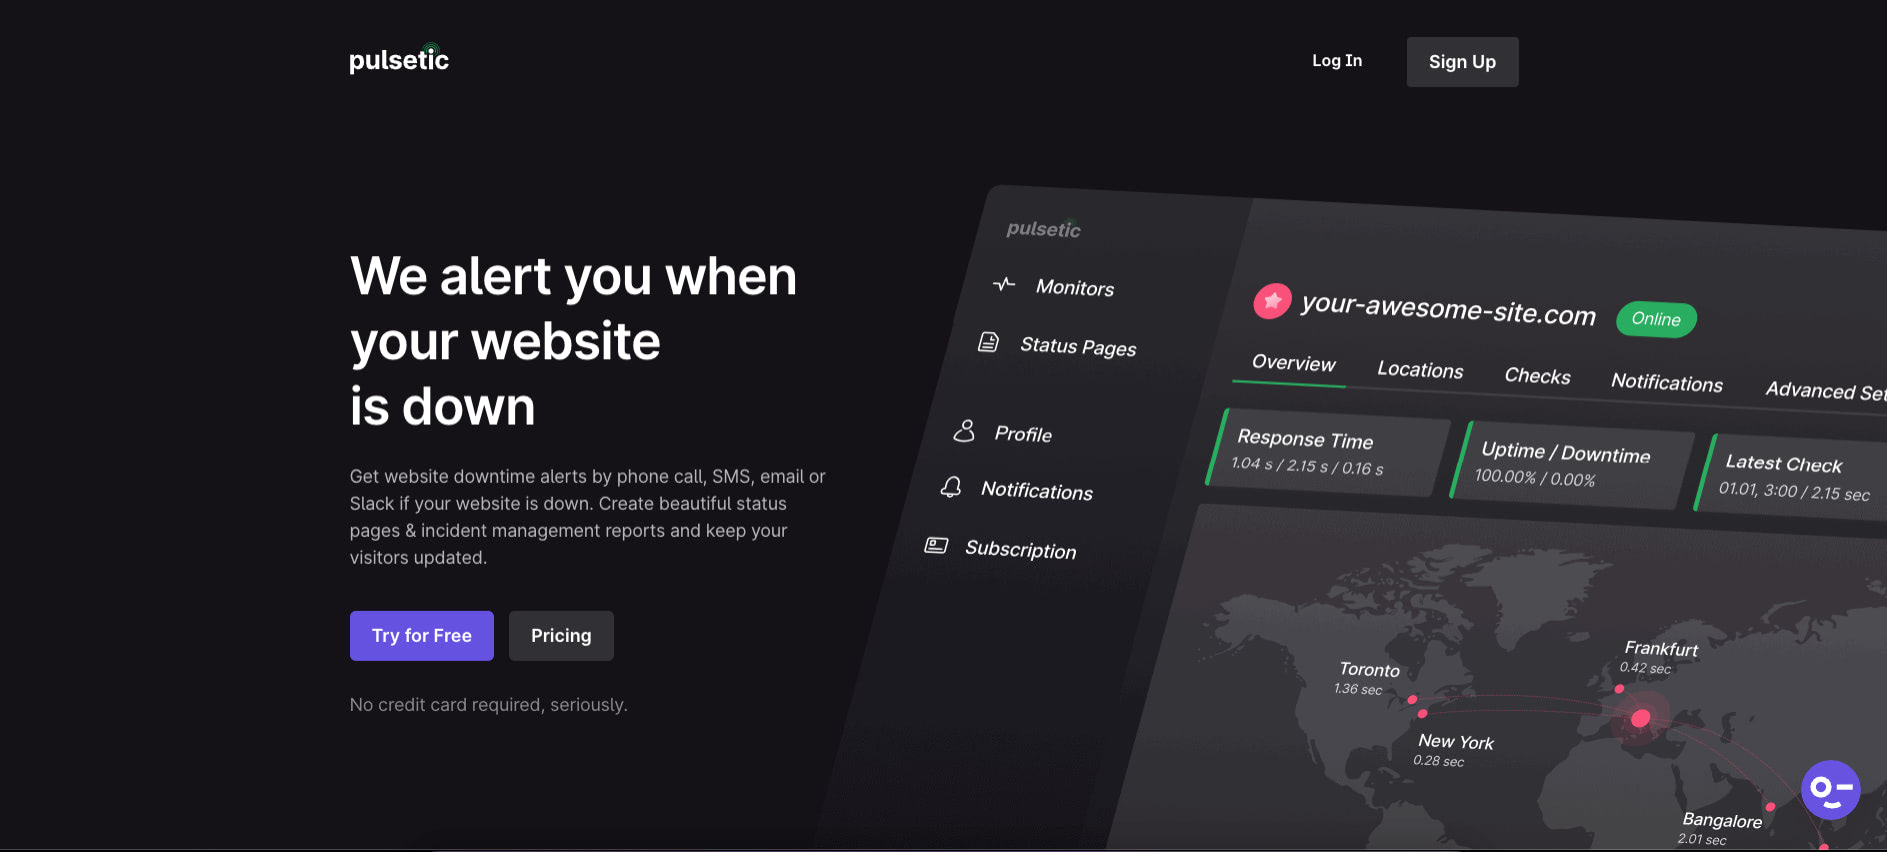 [/figure]
Next, fill in the signup form.
Note: You need to verify your email at sign up.
[figure class=”wide” id=”attachment_644338″ align=”alignnone”]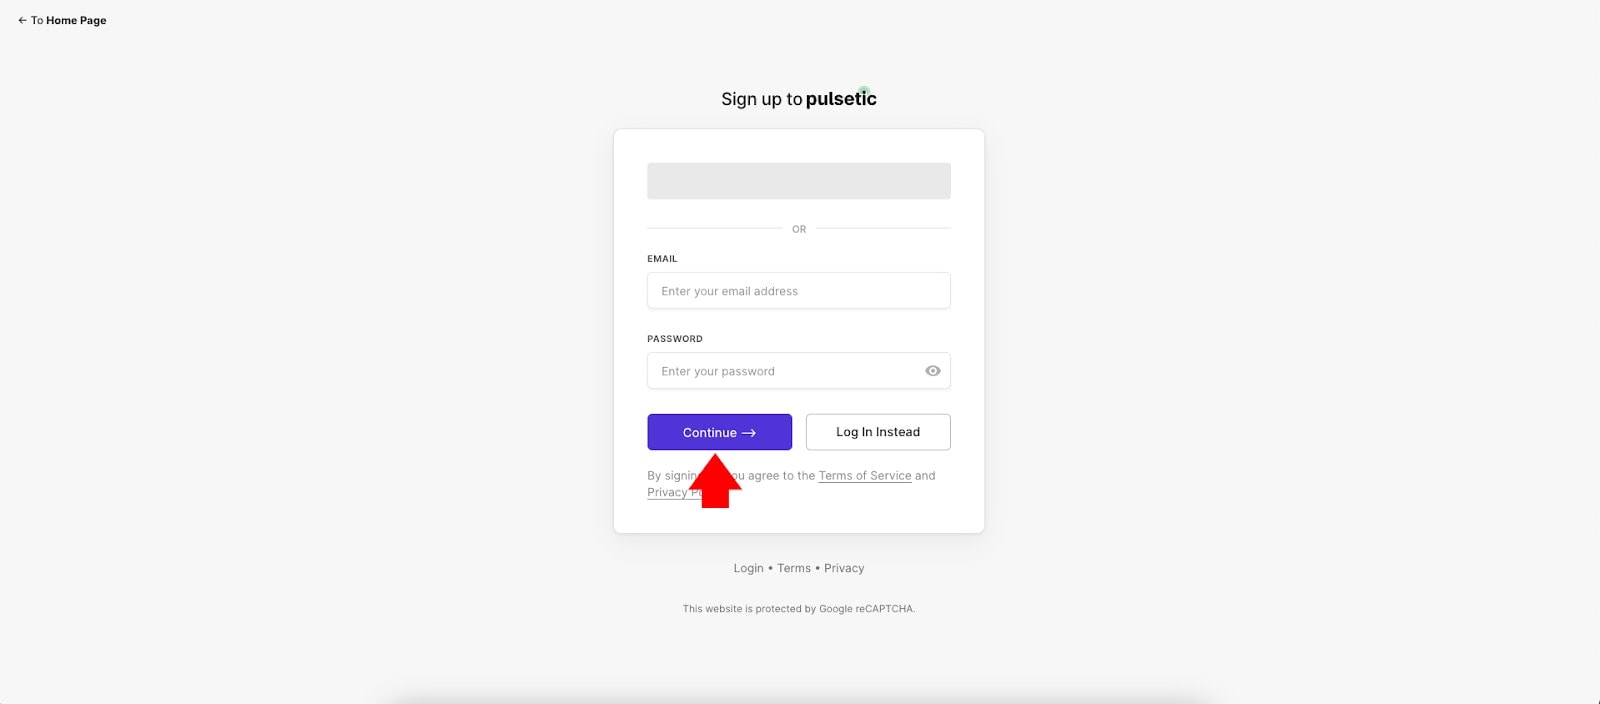 [/figure]
After your email verification process, we will see the dashboard.
Now it’s time to add our WordPress website to Pulsetic’s Monitors List. From the Monitors Dashboard, enter the website URL and click on the “Add Monitor” button located in the upper right corner of the screen, as seen in the image below.
[figure class=”wide” id=”attachment_644339″ align=”alignnone”]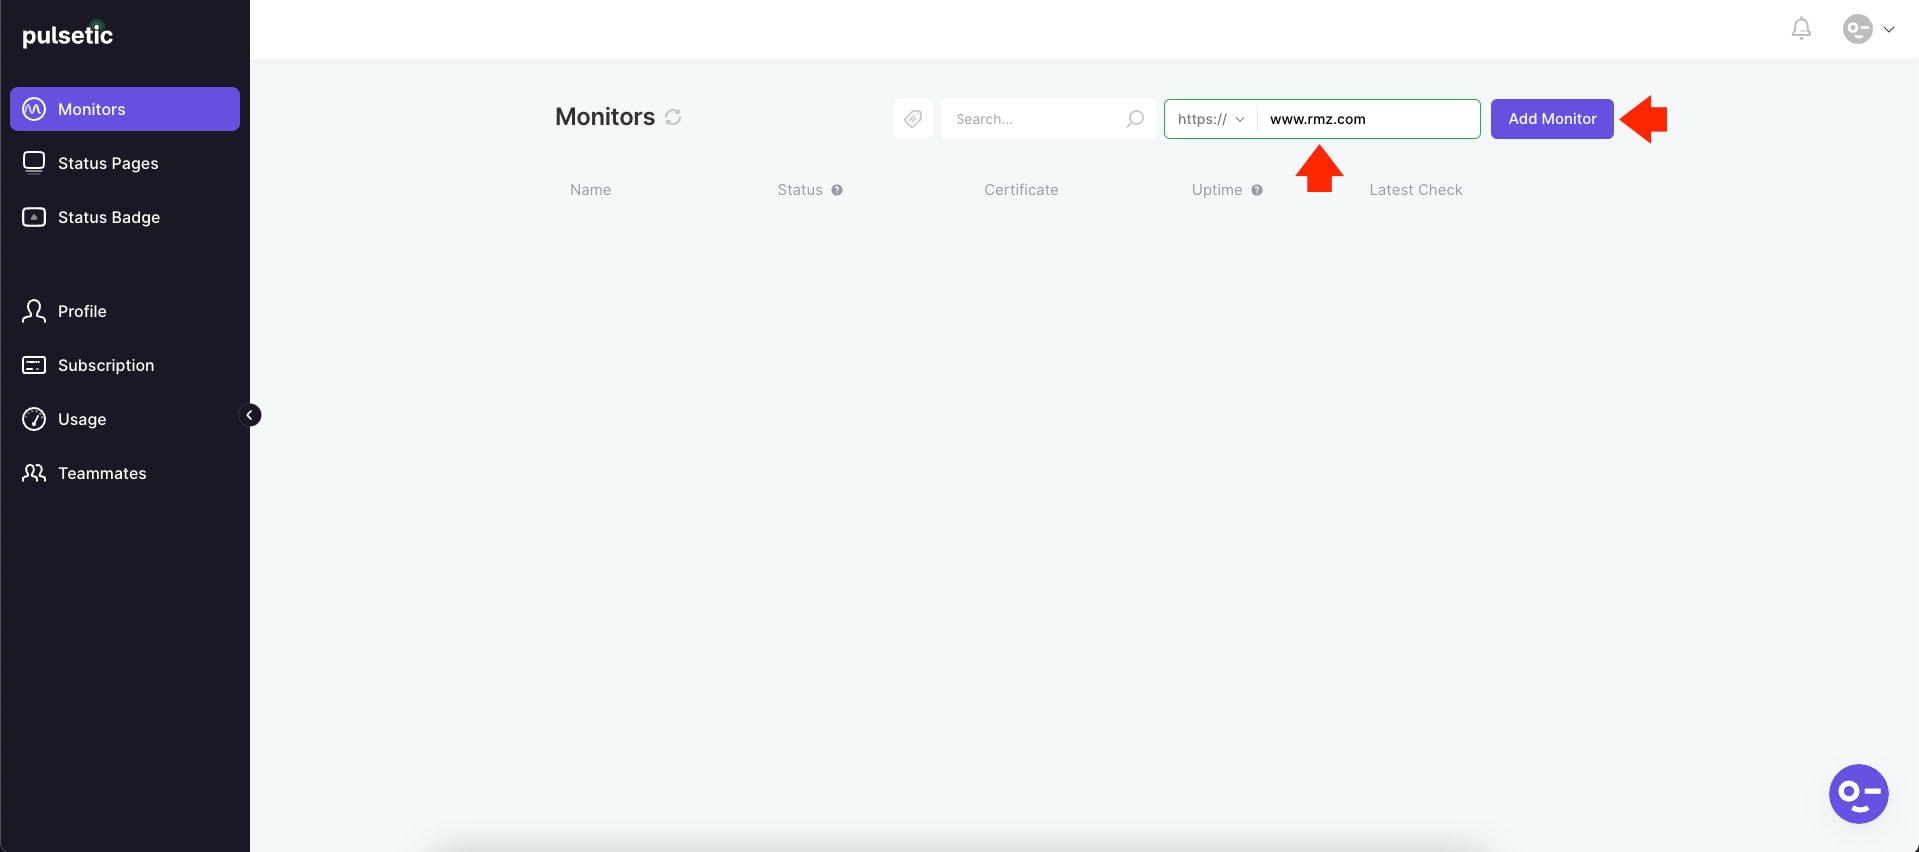 [/figure]
Once Pulsetic has verified our WordPress website, we will see our website on the Monitors list.
Now that our WordPress website is added to the Monitors List, we will start receiving emails about our website’s uptime and downtime similar to the images below.
[figure id=”attachment_644340″ align=”alignnone”]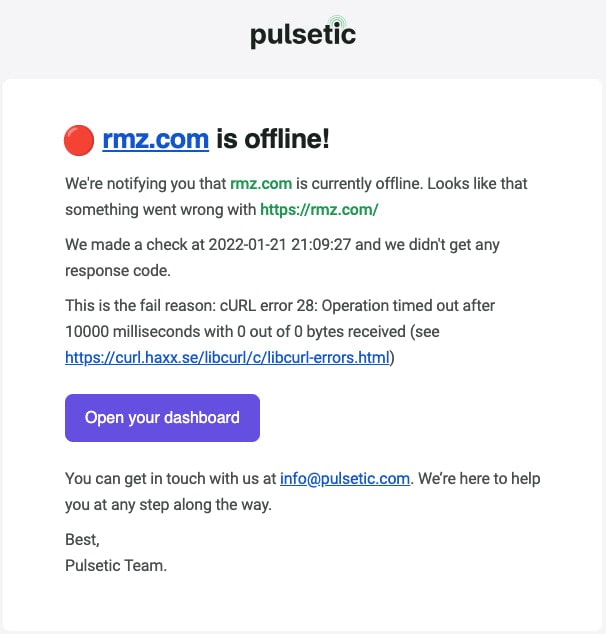 [/figure]
[figure id=”attachment_644341″ align=”alignnone”]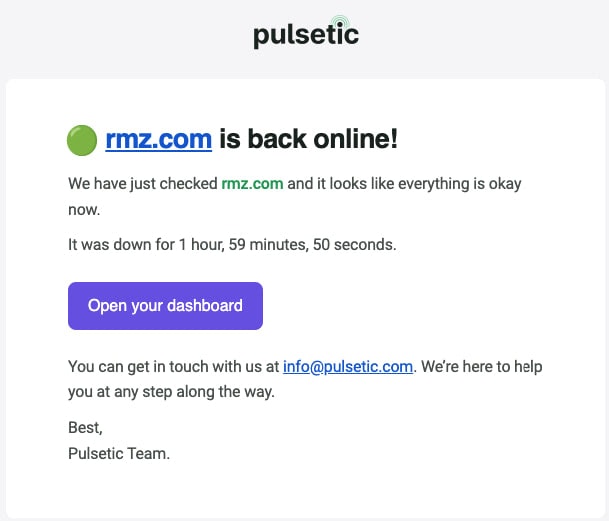 [/figure]
If you click on the “Open your dashboard” button, it will redirect you to the Pulsetic’s Monitor Overview, similar to the image below.
Note: By default, Pulsetic will monitor your website every one minute. You can customize this under “Advanced Settings.” More on this later.
[figure class=”wide” id=”attachment_644342″ align=”alignnone”]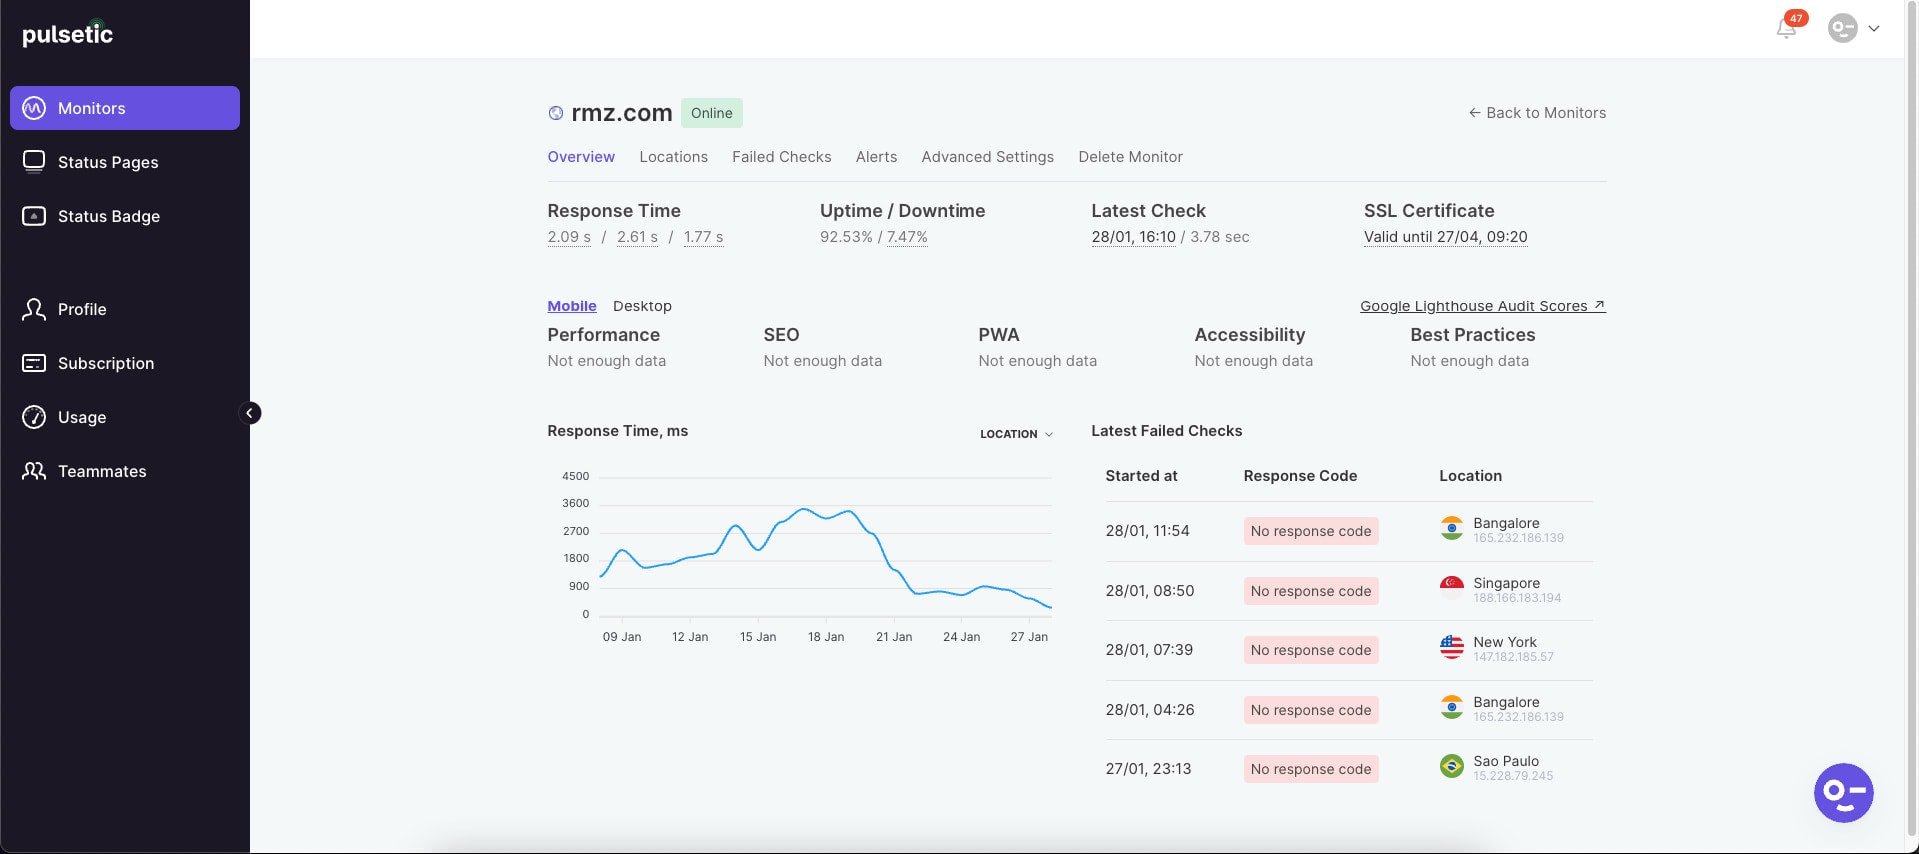 [/figure]
As you can see on the image above, the “Overview” tab provides a history of our website’s uptime and downtimes along with some other information, including accessibility information, performance details on both mobile and desktop, SSL certificate, and more.
By default, you will only receive alert notifications via email. Suppose you want to receive alerts via SMS/Calls, Slack, Telegram, Twilio SMS, Twilio Voice, Webhook, or SIGNL4. In that case, you can configure the settings by clicking on the “Alerts” tab on the Monitors Dashboard.
[figure class=”wide” id=”attachment_644343″ align=”alignnone”]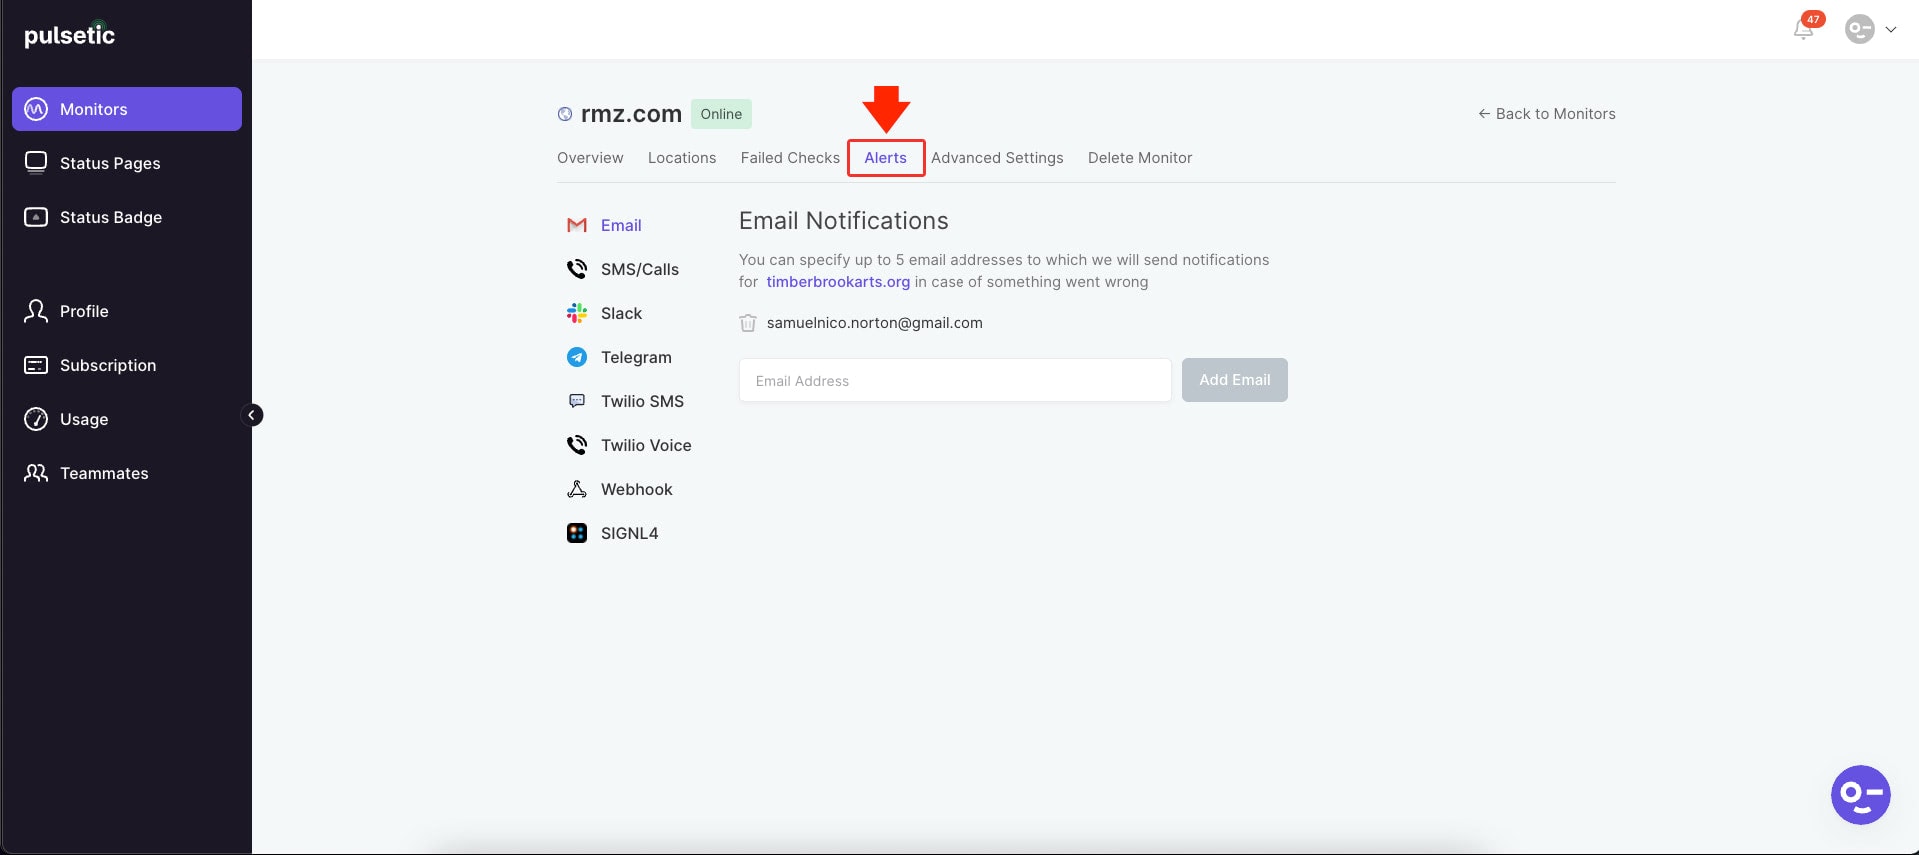 [/figure]
Keep in mind that each platform might require some specific setup as needed.
Under the “Advanced Settings” tab, there are three tabs that you can customize according to your needs:
Under “General Settings,” you can customize the URL, Name, and Request frequency of your website being monitored. Under these settings, you can also change the check frequency related to how often you want to receive alert notifications, which can be 1 minute, 5 minutes, 10 minutes, 15 minutes, 30 minutes, or 1 hour.
[figure class=”wide” id=”attachment_644344″ align=”alignnone”]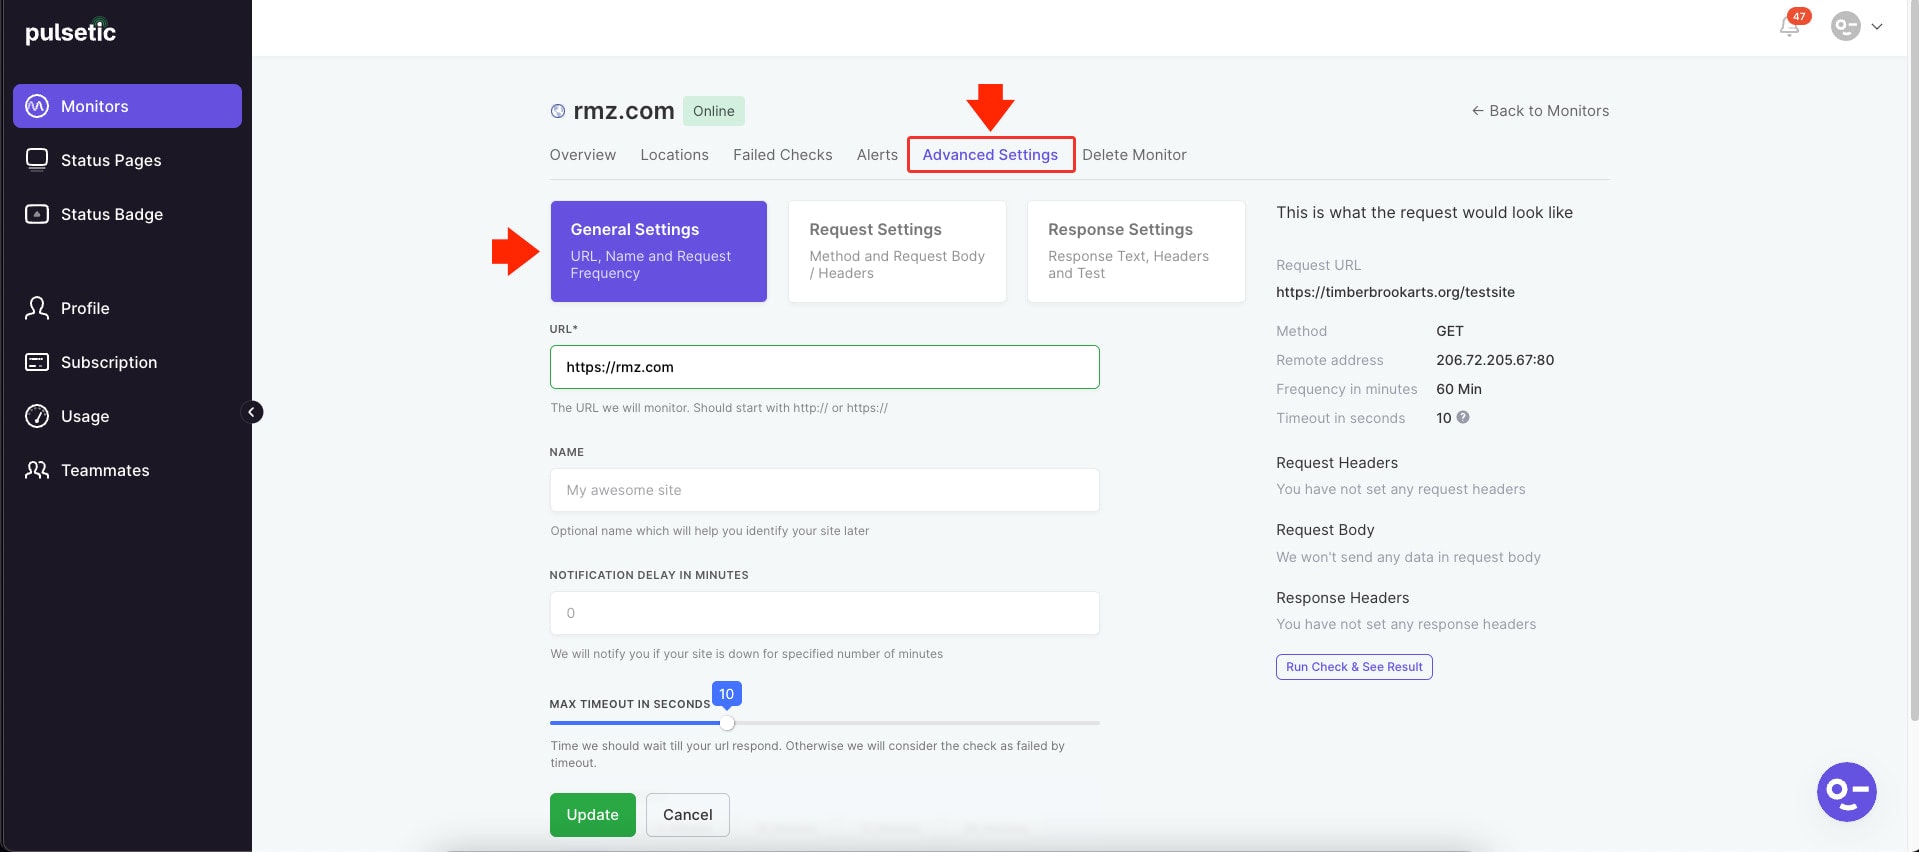 [/figure]
Under “Request Settings,” you can customize the method and request body type under “Request Settings,” including the HTTP headers whenever the platform is making the request. If you are not sure how these settings work, I’ll recommend leaving these settings as they are.
[figure class=”wide” id=”attachment_644345″ align=”alignnone”]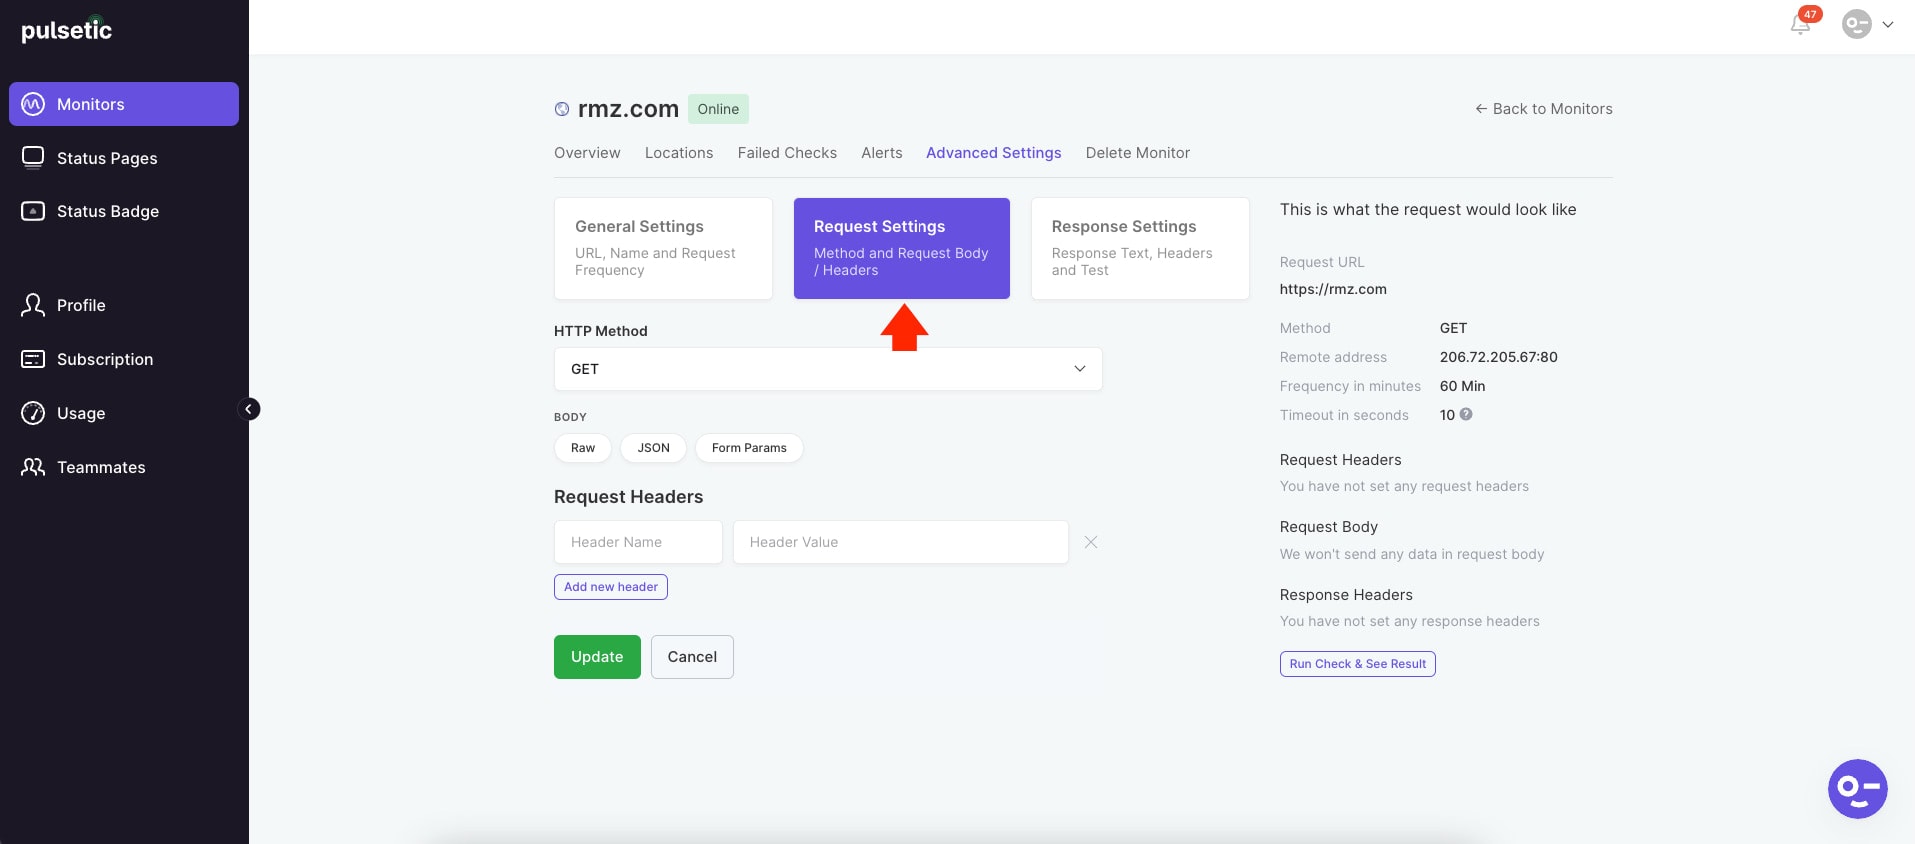 [/figure]
Under “Response Settings“, you can customize the response text, headers, and test under ” Response Settings “. Instead of receiving default response settings from Pulsetic, you can use these settings to control the response from the platform. Again, if you are not sure how these settings work, I recommend leaving them as they are.
[figure class=”wide” id=”attachment_644346″ align=”alignnone”]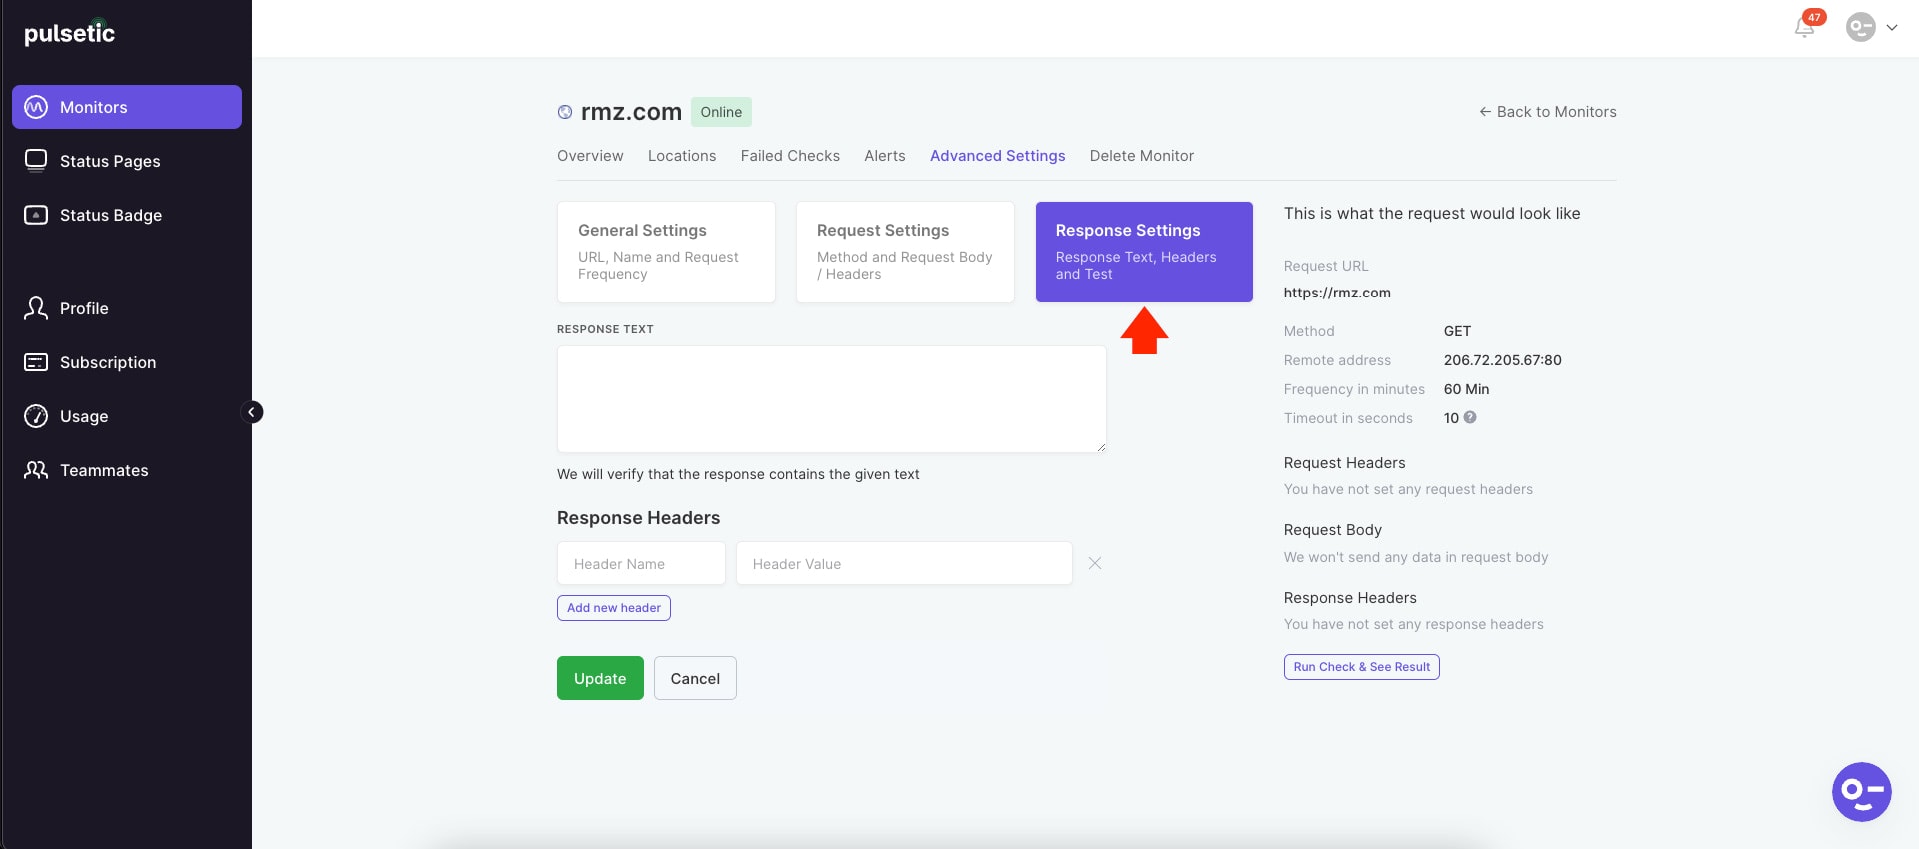 [/figure]
With Pulsetic, you can get an overview of your website’s uptime and downtime in specific locations or countries. Under the “Locations” tab, you will see this information and settings. You can enable or disable each location where you want your website to be checked. The best part of this tab is that it provides users the uptime percentage, response time, the last time and date checked, and a location map with the specific IP address on each country.
[figure class=”wide” id=”attachment_644347″ align=”alignnone”]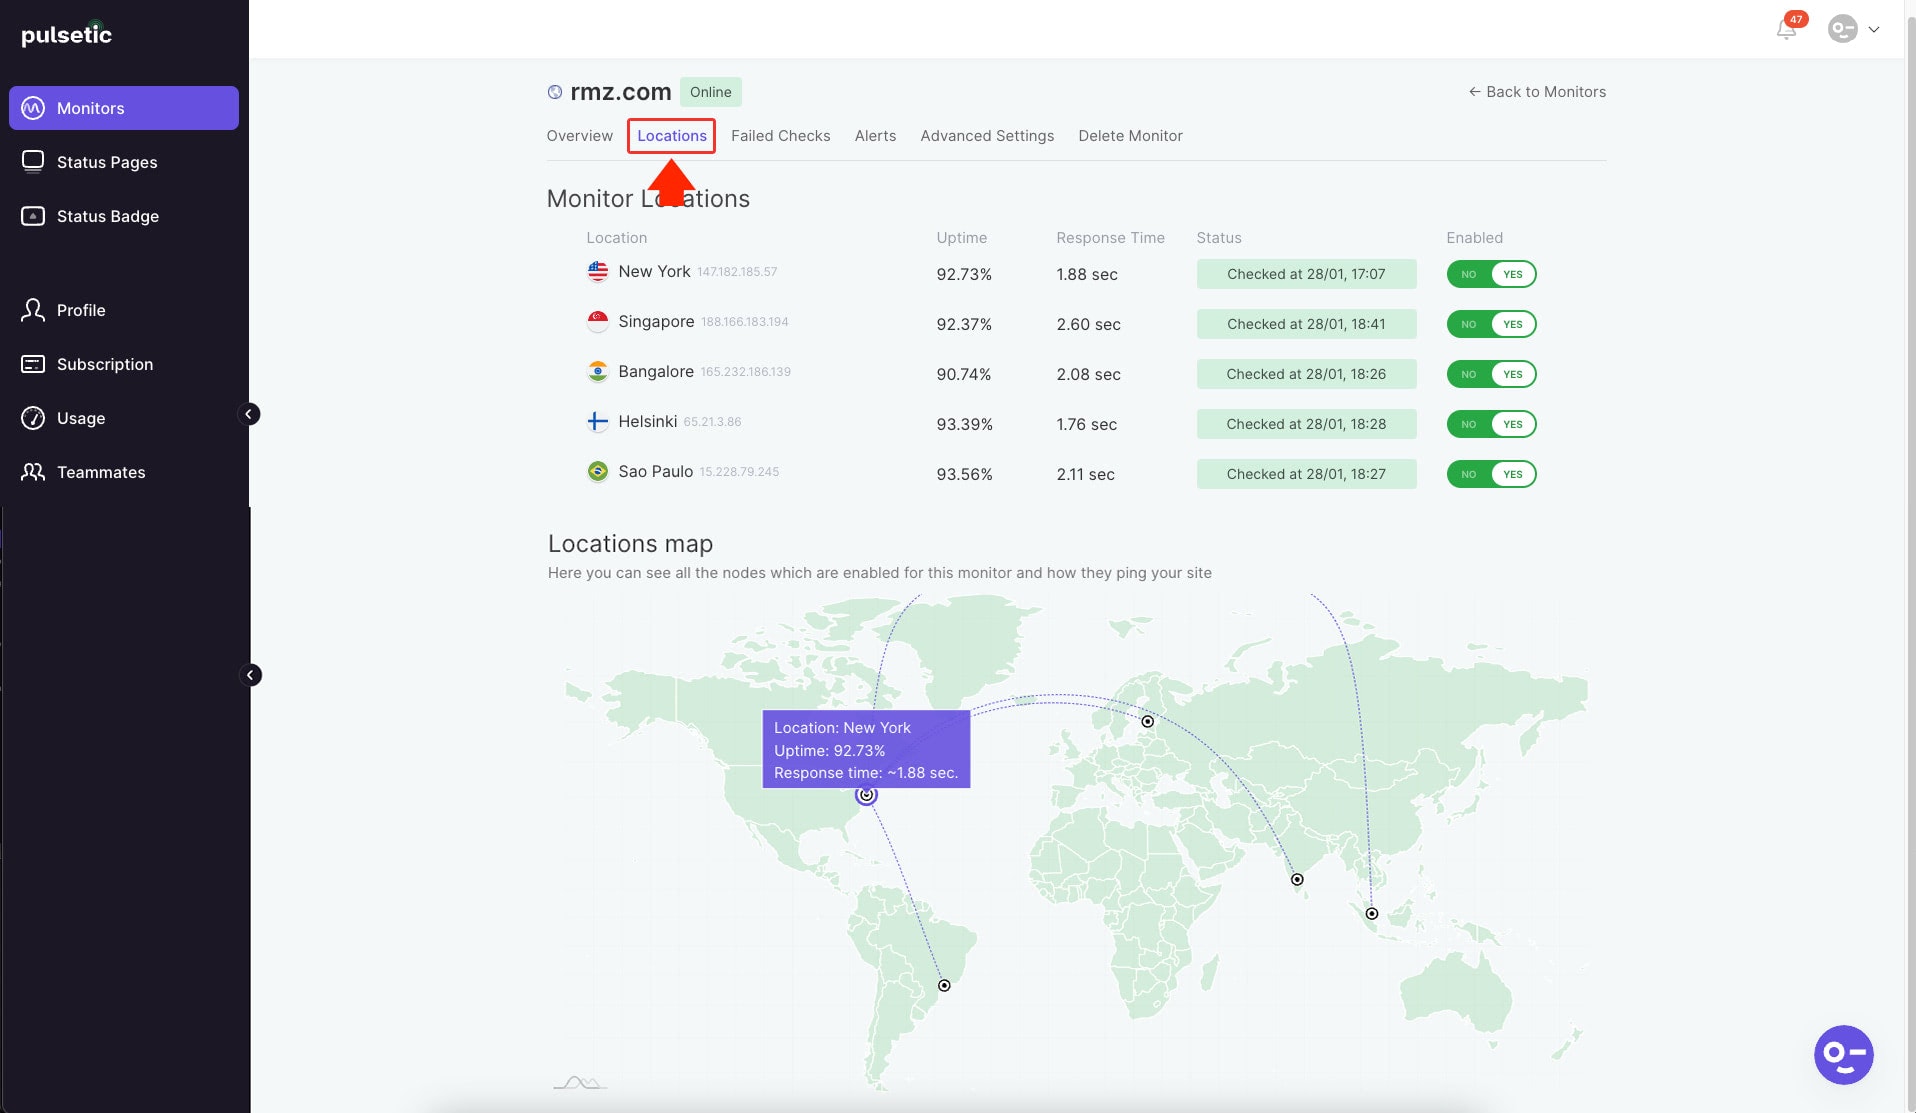 [/figure]
Pulsetic also provides an overview of failed check occurrences, including information about the date, response code, request time, and location when or where the platform was unable to receive any feedback from your website. This information can be found under the “Failed Checks” tab.
[figure class=”wide” id=”attachment_644348″ align=”alignnone”]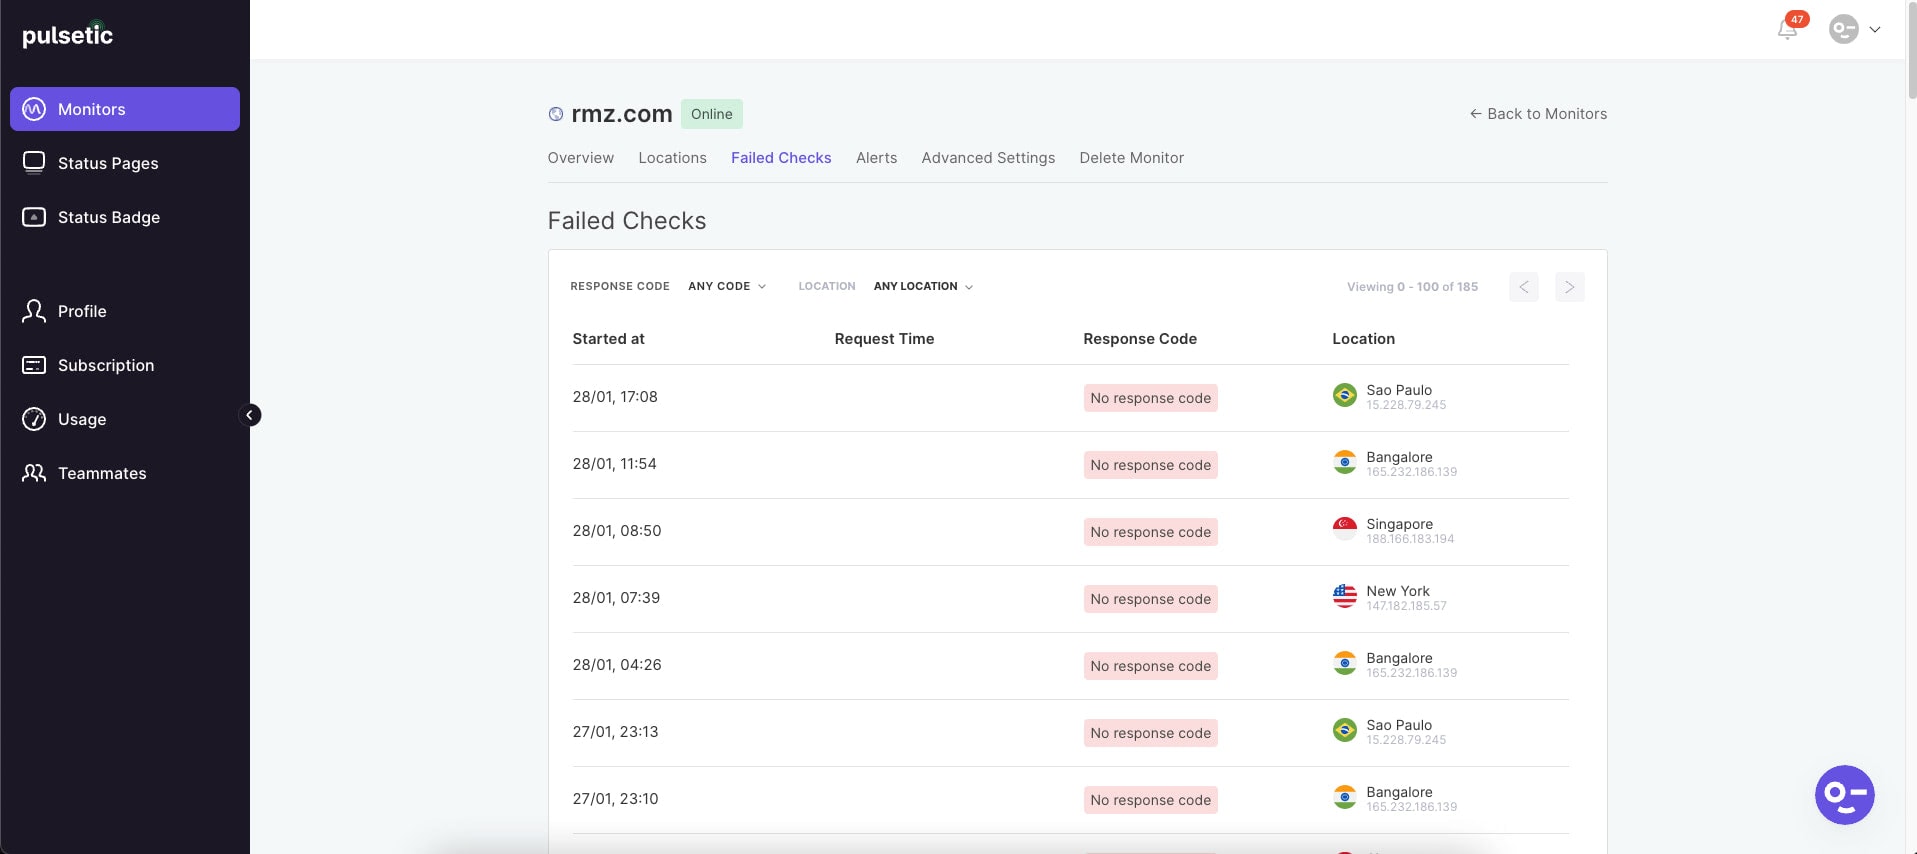 [/figure]
Last, if you wish to directly access these settings on a specific website that was added on the Pulsetic’s Monitors List, click on the three dots icon on the right corner of the website URL you wish to select and then click on the specific action you wish to do as seen in the image below.
[figure class=”wide” id=”attachment_644349″ align=”alignnone”]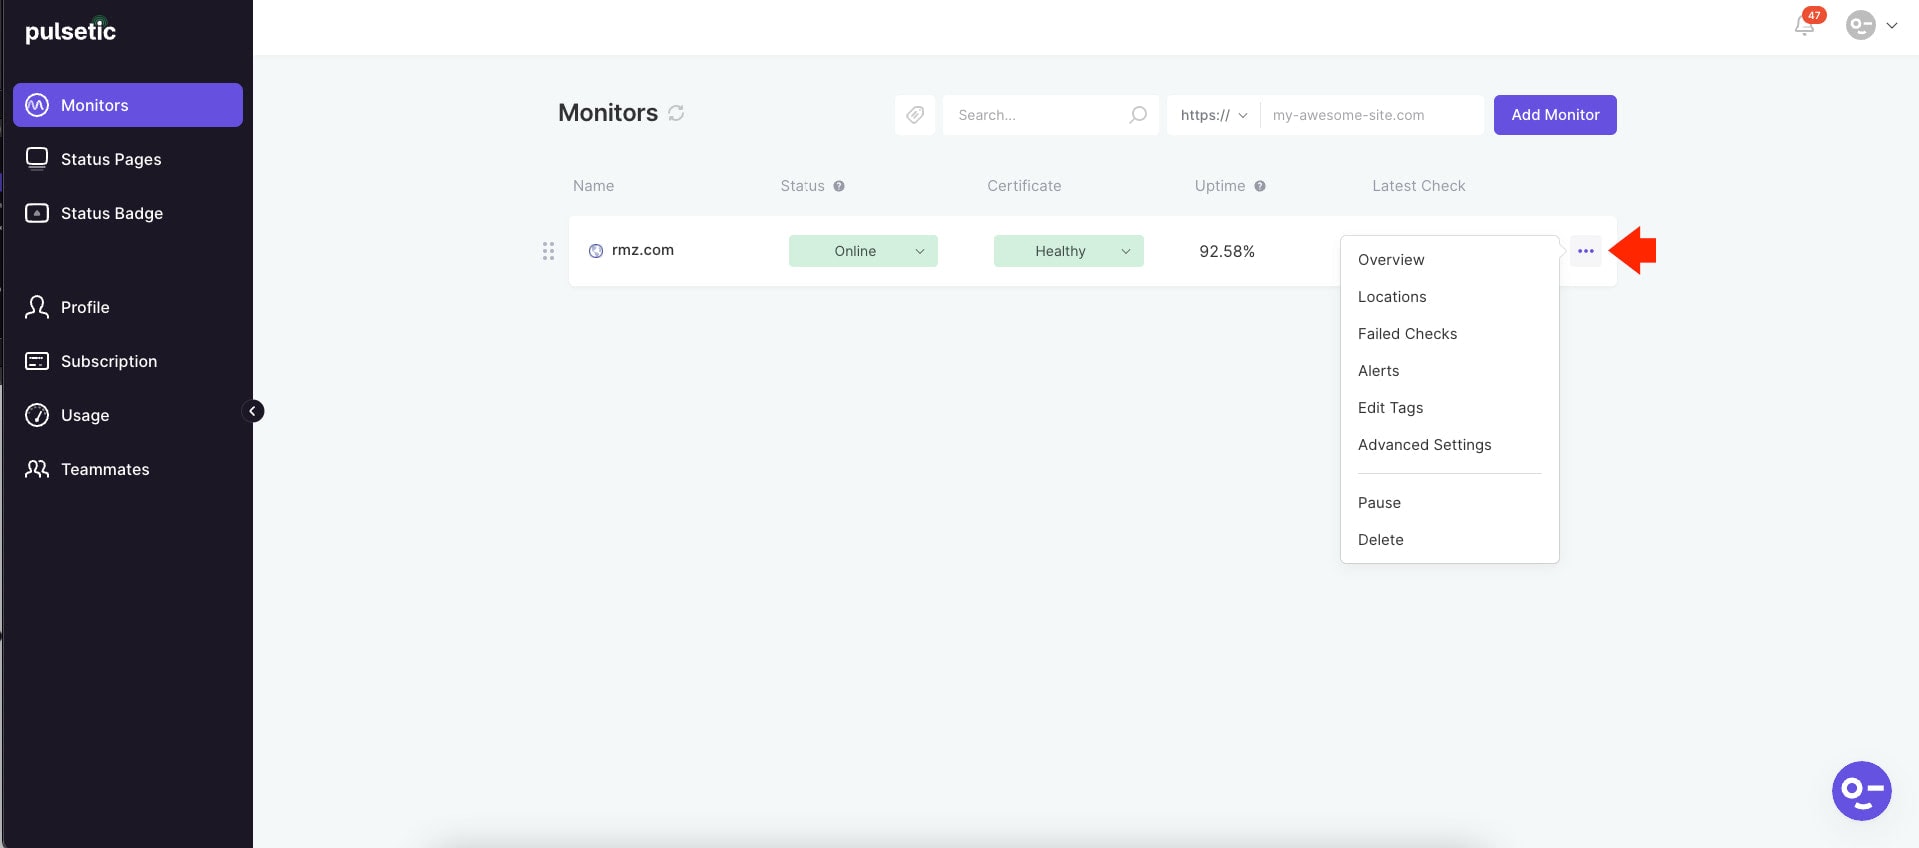 [/figure]
Website downtime can be expensive in terms of website revenue, search engine ranking, and branding. Reliability and consistent presence on the web are vital for any online business. That’s why Website uptime monitoring is such a tedious process. While there are many reasons for a website to go down, monitoring uptime and timely alerts will minimize the potential costly downtime.
In this tutorial, we’re able to discuss how Pulsetic can help you as a website owner or developer monitor your WordPress website’s uptime and downtime in a series of simple steps. Pulsetic is one of the great uptime monitoring services, which provides you with uptime/downtime overview, performance metrics, and incident management reports by giving you downtime alerts by phone call, SMS, email, or Slack when your website is down. The best feature is that it offers many customizable settings according to your website need or configuration.